

The Hotel Volatility Index (HVI), now in its fifth year is released as part of the Hotelivate 2022 Indian Hospitality Trends and Opportunities Report. We have often noticed that the performance statistics of a market are skewed due to the opening of new hotels; hotels that are yet to stabilise pull down either the overall occupancy, the average rate, or both. This is especially true for rapidly emerging hotel markets such as India. We have selected a base of well-established and stabilised hotels which have been operational since 2012 or earlier. The Hotel Volatility Index (HVI) can provide an accurate gauge of the country’s hotel industry and serve as a reliable benchmark for properties across India. In this period of uncertainty, the HVI is one of the most important indicators for the hotel industry. Even though the hotel markets have seen recovery, the global pandemic has affected the key metrics of nationwide performance. Therefore, the HVI can help owners/operators develop a clear idea of the performance of stabilised assets during this period.
We developed the HVI five years ago (in 2017). Since the hotel market in India has grown considerably in the past few years, the base of the Hotel Volatility Index has been expanded this year from 80 hotels to 100 hotels. These include 70 urban and 30 leisure properties across positioning. The historical data has been updated as per the new sample set. Together, these hotels represent nearly 20,000 rooms (~13% of the total inventory represented in the report) of 19 hotel companies across 36 different cities in India.

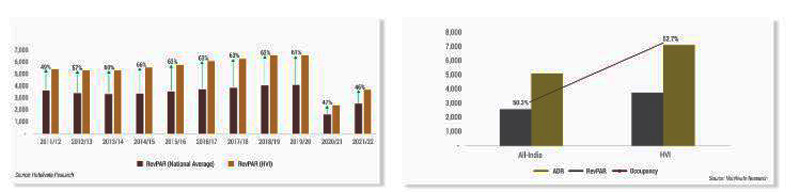
Figure 1, below, illustrates the occupancy, average rate, and RevPAR performance of the index between 2012/13 and 2021/22, further categorized by type of location.
FIGURE 1: HOTEL VOLATILITY INDEX | URBAN AND LEISURE LOCATIONS

The performance of leisure hotels vis-à-vis the performance of urban hotels presented in Figure 1 must be carefully studied. Due to package deals and quarantine business, urban hotels managed to pull up their occupancy; however, they saw a reduction in their ADRs compared to previous years. Unlike their urban counterparts, leisure hotels, on the back of strong domestic and leisure travel, were able to not only increase their occupancy but also managed to increase their average rates to an all-time high of INR 14,457 (a 21% increase over 2020/21). Even though RevPAR has not recovered to pre-pandemic levels, leisure markets have seen a stronger revival during this period. This indicates a clear shift in the consumer behaviour of the Indian traveller. Indian tourists are looking to explore destinations within the country; they want to scout for off-beat places to visit, preferably within driving distance from their home city. Even though leisure hotels will most likely see a downward rate correction to a certain degree, the room night contribution from domestic travellers is likely to stabilise at higher than pre-pandemic levels. Additionally, the return of corporate and foreign travel would catalyse an increase in the overall performance of both leisure and urban hotels.
In line with the nationwide recovery, the HVI hotels recorded an occupancy of 52.7% at an ADR of INR 6,877 in 2021/22 as compared to 34.8% at an ADR of INR 6,632 in 2020/21. In comparison to the nationwide average, these hotels, therefore, saw a marginally stronger recovery in performance (Figure 2).
FIGURE 2: HVI vs NATIONAL AVERAGE | 2021/22
Looking at the HVI through the lenses of City Tiers (Figure 3) and Administrative Zones (Figure 4), we can see HVI hotel performance mimicking the nationwide trend. It is interesting to note, however, that hotels in South India which had seen a slower revival at a nationwide level, have recovered strongly for the HVI hotels. Similarly, Tier 2 cities, which had a relatively weaker revival at a nationwide level, have seen growth in their business which is in line with Tier 1 and Tier 3 cities. This indicates that stable-state assets are more resilient to economic volatility and are likely to provide better returns to both the owners and the operators.
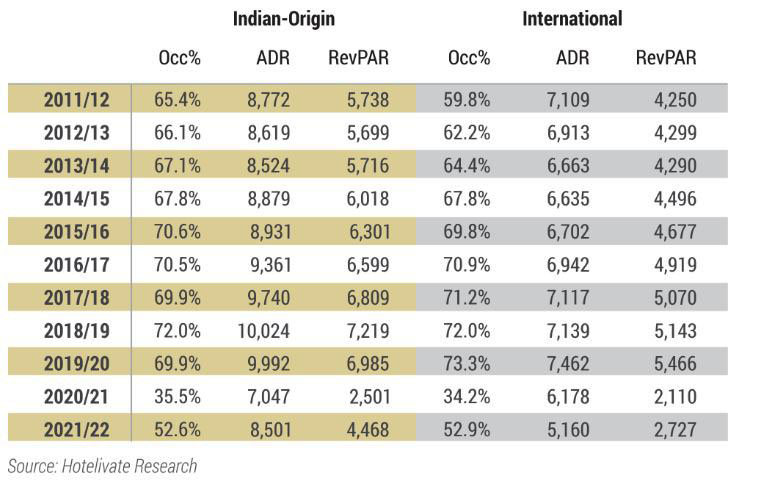
FIGURE 3: KEY OPERATING STATISTICS BY CITY TIERS | 2021/22
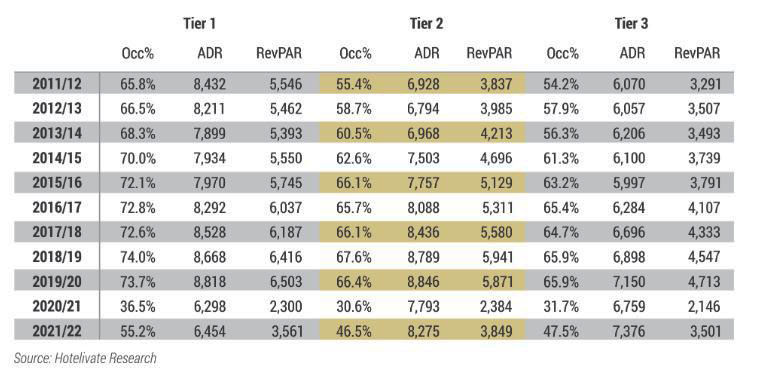
FIGURE 4: KEY OPERATING STATISTICS BY ADMINISTRATIVE ZONE | 2021/22

Examining the performance of Indian-origin and international brands (Figure 5) in the HVI reveals that the Indian-origin brands have seen a much stronger recovery compared to their international counterparts. As mentioned earlier, the reasons behind this difference are due to a larger leisure footprint for Indian-origin brands, coupled with locally negotiated contracts and a sizable local network which has allowed them to capture a larger chunk of domestic demand. As the corporate and international footprint grows, this difference is likely to minimise and revert to historical trends.
FIGURE 5: KEY OPERATING STATISTICS BY ORIGIN OF BRAND | 2021/22
In conclusion, it is safe to say that the industry has seen a steady revival. The trendlines indicate a much stronger performance for stabilised hotels during 2022/23. The optimisation and the efficiencies which were introduced during the pandemic are likely to benefit most hotels in the medium to long term. Moreover, the data and analyses clearly indicate that hotel owners need to be patient and allow their assets to ramp up and stabilise to benefit from economic resilience along with higher and steady returns.